Problem set 2
IMPORTANT: This looks like a lot of work, but it’s mostly copying/pasting chunks of code and changing things.
Getting started
For this problem set, you’ll practice running and interpreting regression models using data about penguins in Antarctica and data on food access and mortality in the US.
You’ll be doing all your R work in R Markdown this time (and from now on). You should use an RStudio Project to keep your files well organized (either on your computer or on RStudio.cloud). Either create a new project for this exercise only, or make a project for all your work in this class.
You’ll need to download these two CSV files and put them somewhere on your computer or upload them to RStudio.cloud—preferably in a folder named data in your project folder:
You’ll also need to download this R Markdown file with a template for this problem set. Download that here and include it in your project:
In the end, the structure of your project directory should look something like this:
your-project-name\
  your-name_problem-set-2.Rmd
  your-project-name.Rproj
  data\
    penguins.csv
    food_health_politics.csv
To check that you put everything in the right places, you can download and unzip this file, which contains everything in the correct structure:
You’ll need to make sure you have these packages installed on your computer: tidyverse and modelsummary. If you try to load one of those packages with library(tidyverse) or library(modelsummary), etc., and R gives an error that the package is missing, use the “Packages” panel in RStudio to install it.
(Alternatively, you can open the project named “Problem Set 2” on RStudio.cloud and complete the assignment in your browser without needing to install anything. If you don’t have access to the class RStudio.cloud account, please let me know as soon as possible. This link should take you to the project—if it doesn’t, log in and look for the project named “Problem Set 2.”)
Remember that you can run an entire chunk by clicking on the green play arrow in the top right corner of the chunk. You can also run lines of code line-by-line if you place your cursor on some R code and press ⌘ + enter (for macOS users) or ctrl + enter (for Windows users).
Make sure you run each chunk sequentially. If you run a chunk in the middle of the document without running previous ones, it might not work, since previous chunks might do things that later chunks depend on.
Remember, if you’re struggling, please talk to me. Work with classmates too. Don’t suffer in silence!
Instructions
For this problem set, we’re less interested in causal relationships and more interested in the mechanics of manipulating data and running regressions in R. We’ll start caring about identification and causal models in the next problem set. Because of this, don’t put too much causal weight into the interpretations of these different models—this is an actual case of correlation not implying causation.
The example for week 2 on regression will be incredibly helpful for this exercise. Reference it. Copy and paste from it liberally.
Rename the R Markdown file named
your-name_problem-set-2.Rmdto something that matches your name and open it in RStudio.Complete the tasks given in the R Markdown file. Fill out code in the empty chunks provided (you can definitely copy, paste, and adapt from other code in the document or from the regression example—don’t try to write everything from scratch!), and replace text in ALL CAPS with your own. (i.e. You’ll see a bunch of
TYPE YOUR ANSWER HEREs. Type your answers there.). Again, you don’t need to type your answers in all caps.
Turning everything in
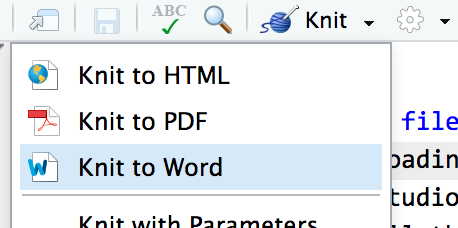
When you’re all done, click on the “Knit” button at the top of the editing window and create an HTML or Word version (or PDF if you’ve installed tinytex) of your document. Upload that file to iCollege.